COVID-19 World View Dashboard
Due to some requests I want to make my «private» COVID-19 dashboard generally available. The dashboard provides you with the most important information about the worldwide development. The underlying CSSEGISandData is updated and processed once a day.
My added value — dig deeper into the COVID-19 data
By the time I started this dashboard I couldn’t find anything that enables me to dig a little deeper into the data and play around a little bit. So I decided to quickly build my own dashboard. The underlying data is publicly available and provided by CSSEGISandData.
See and click for yourself
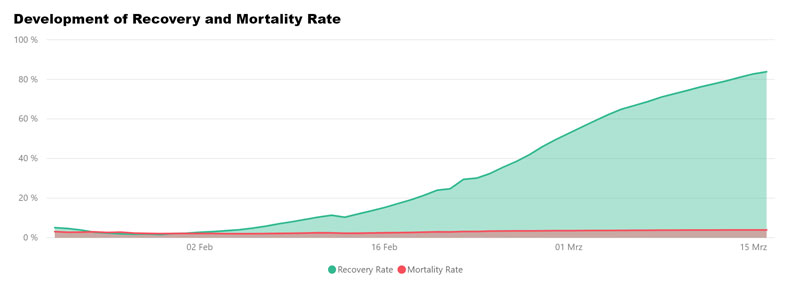
Only China

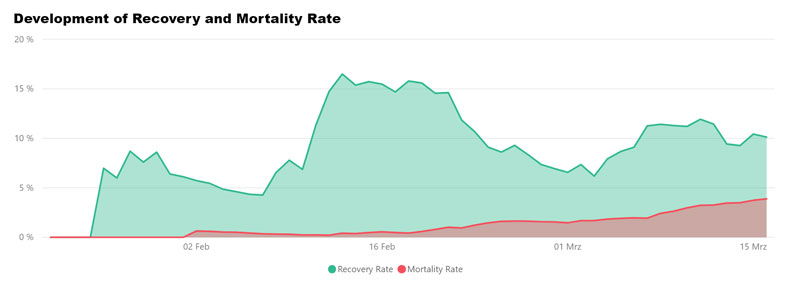
Rest of the world — without China

As of now (03-17-2020) China seems to be in control of the entire outbreak. There are rarely any new cases reported. At the same time the number of recovered cases increases steadily. China was able to keep the number of death cases relatively constant.
On the contrary the rest of the world experienced a rather staggering increase in reported cases. Also the number of death cases seems to increase rather rapidly. Recovered cases seem to have a similar growth rate as death cases.
As of now (03-17-2020) China managed to maintain a steadily increase recovery rate. On the COVID-19 dashboard you can see the development on a running animation.
The remaining world doesn’t seem to be much prepared as the recovery rate fluctuates a lot. This might be due to ever new outbreaks in new countries and regions. Many times each country or region has its own way to manage the situation (for the good or bad). The mortality rate in remaining world constantly increases.
Only China
Rest of the world — without China
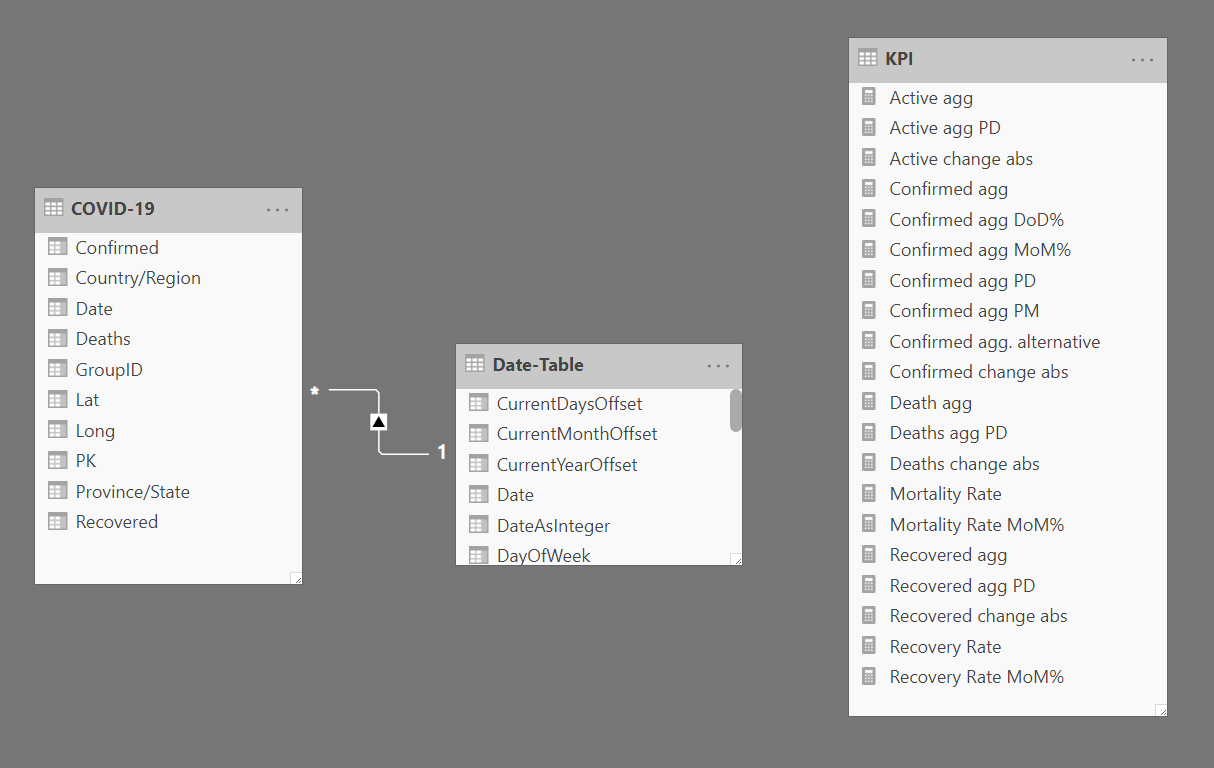
A simple data model
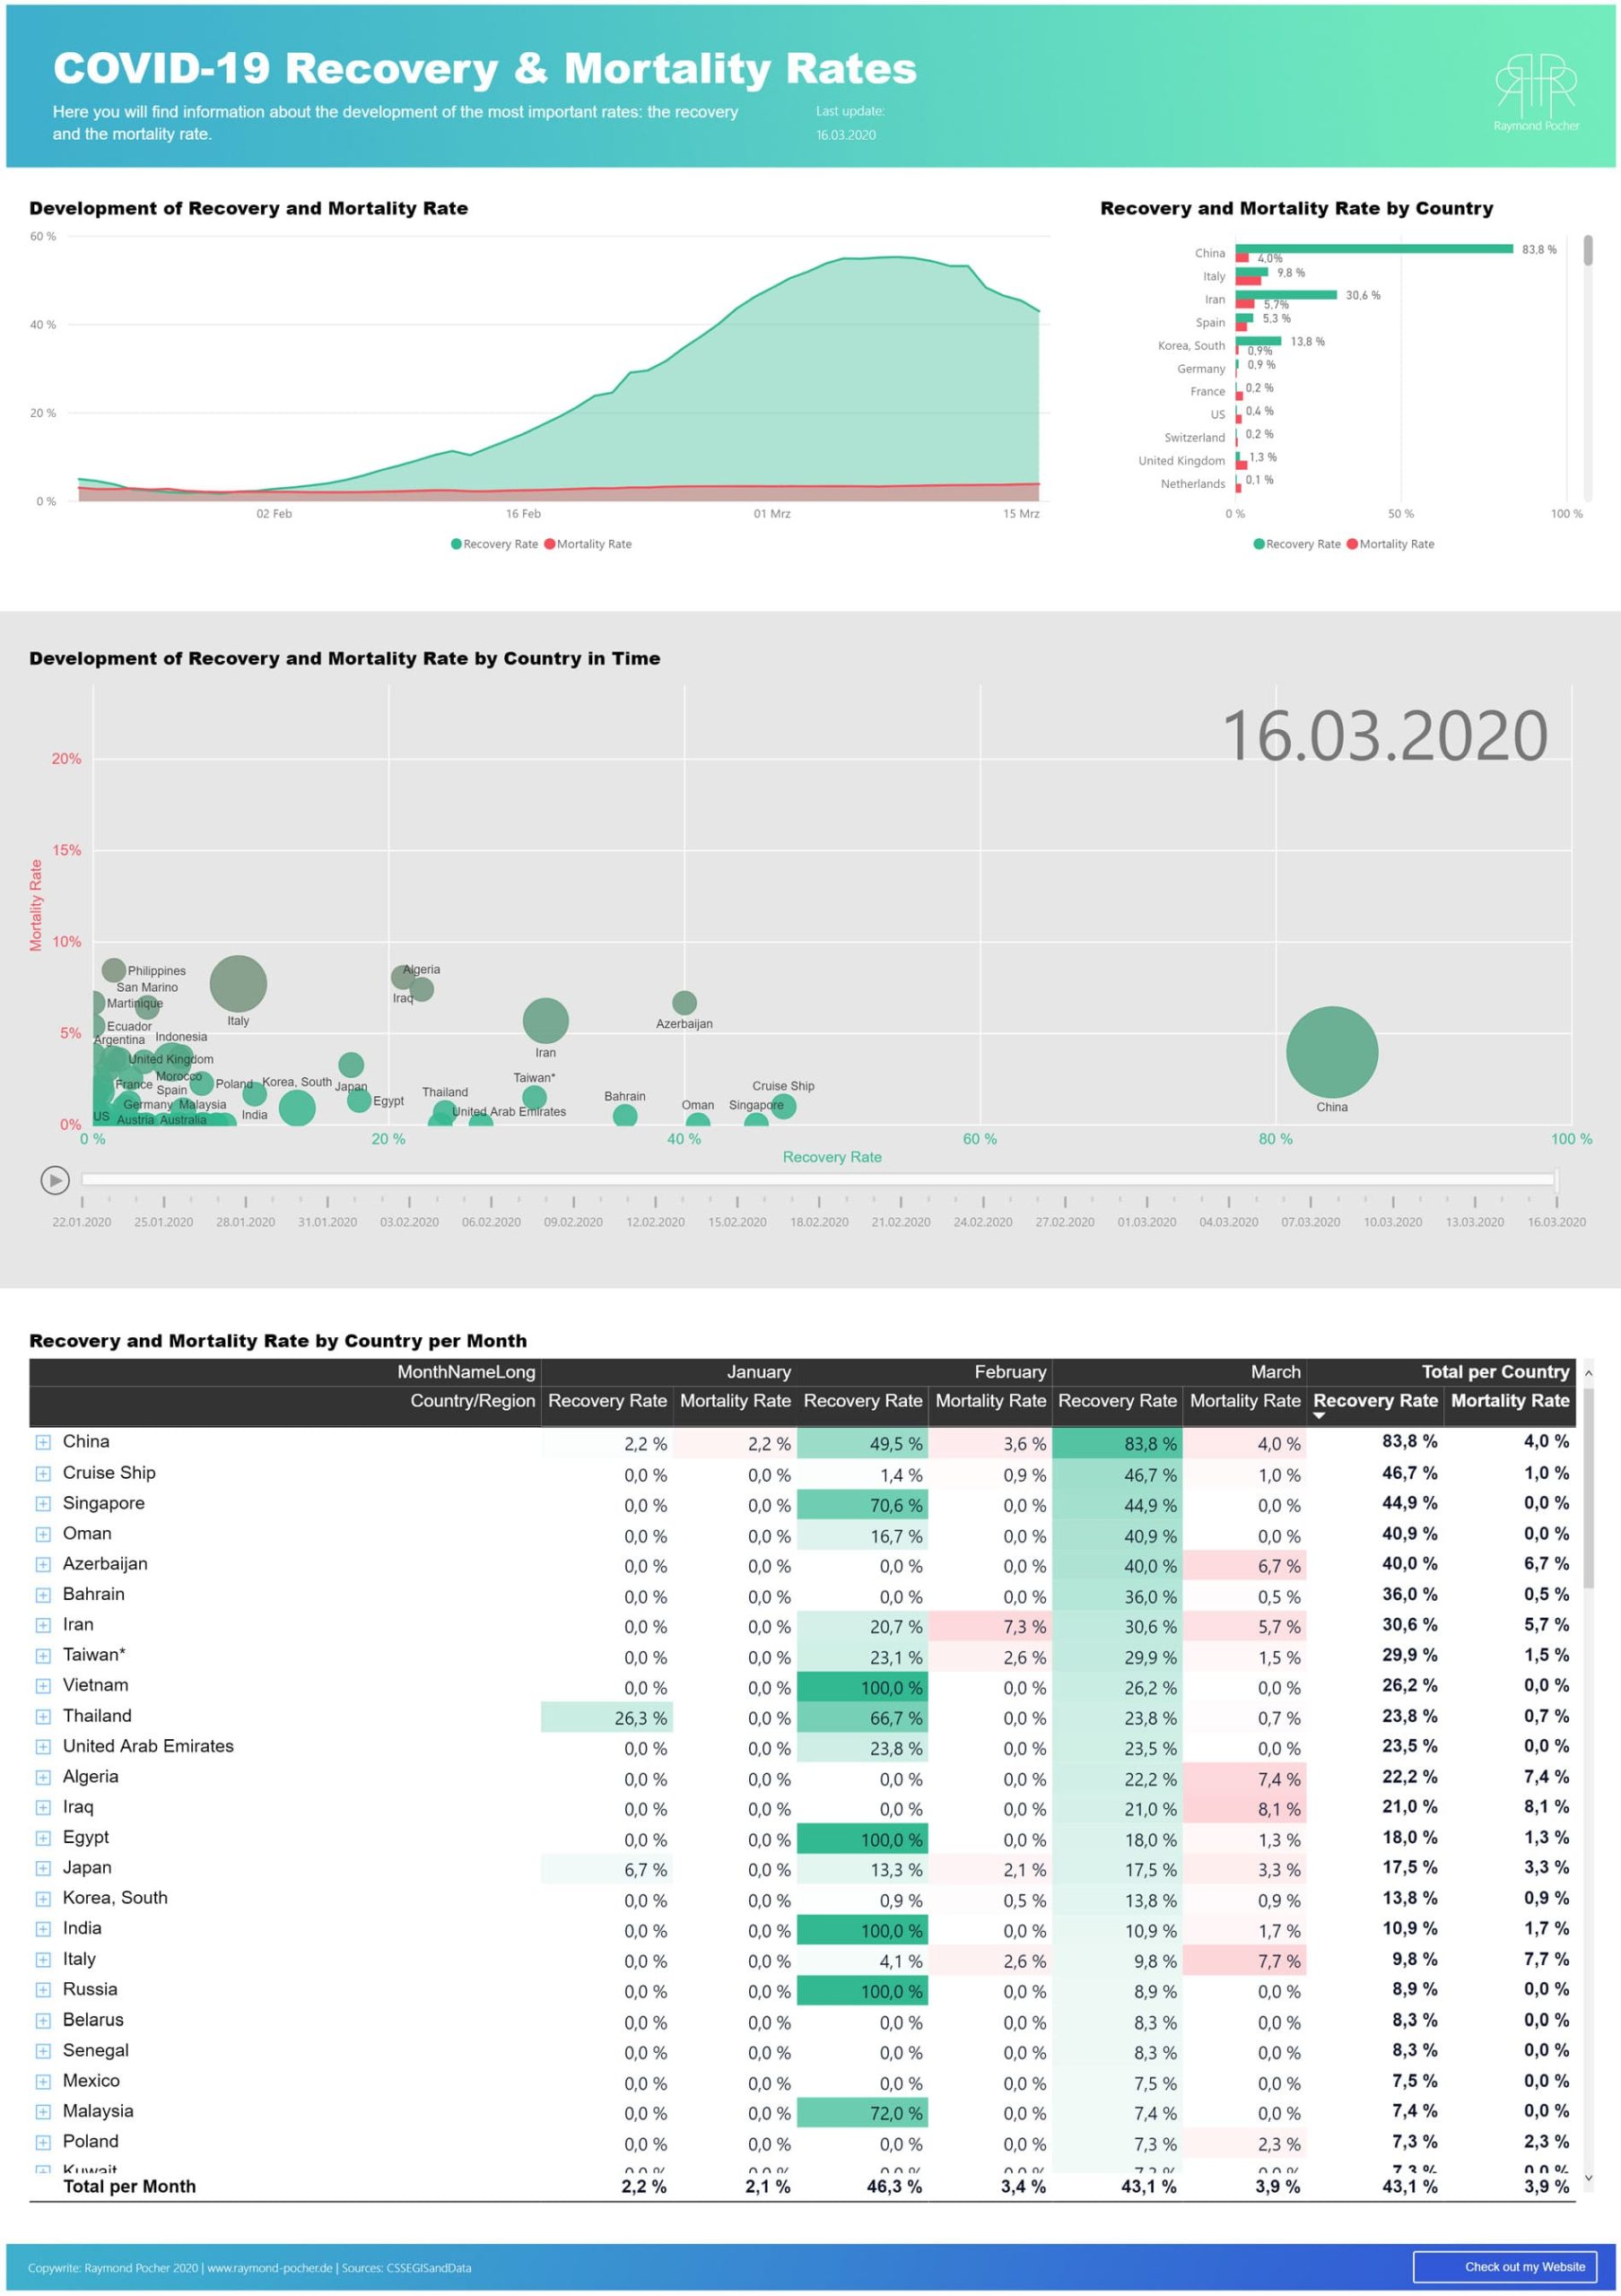
The underlying dataset cannot be simpler, yet the reporting provides valuable insights that otherwise would have been hard to detect. Follwing a few images of the COVID-19 Dashboard


More Stuff